Pertzel Lab · Season 1 · Week 3
Preparing ECG data for testing the AI fairly.
Three things a fair test needs, and a clock problem found on the way.
No score this week, on purpose. Before an AI can be tested on 482 heart recordings from surgery, the recordings have to become questions it can take, each one needs an answer key that matches it, and the marking rules have to be fixed before anyone sees an answer. That took the week, and it turned up a problem that would have made any score meaningless.
A fair test needs three things.
The AI I am testing, ECGFounder, learned to read heart traces from standard ten-second ECG tests. I want to know how it does on traces it was never trained on: recorded off the monitor during surgery, by a different machine, for hours at a time. Scoring it against the doctors’ labels is an exam, and an exam is only fair if three things hold.
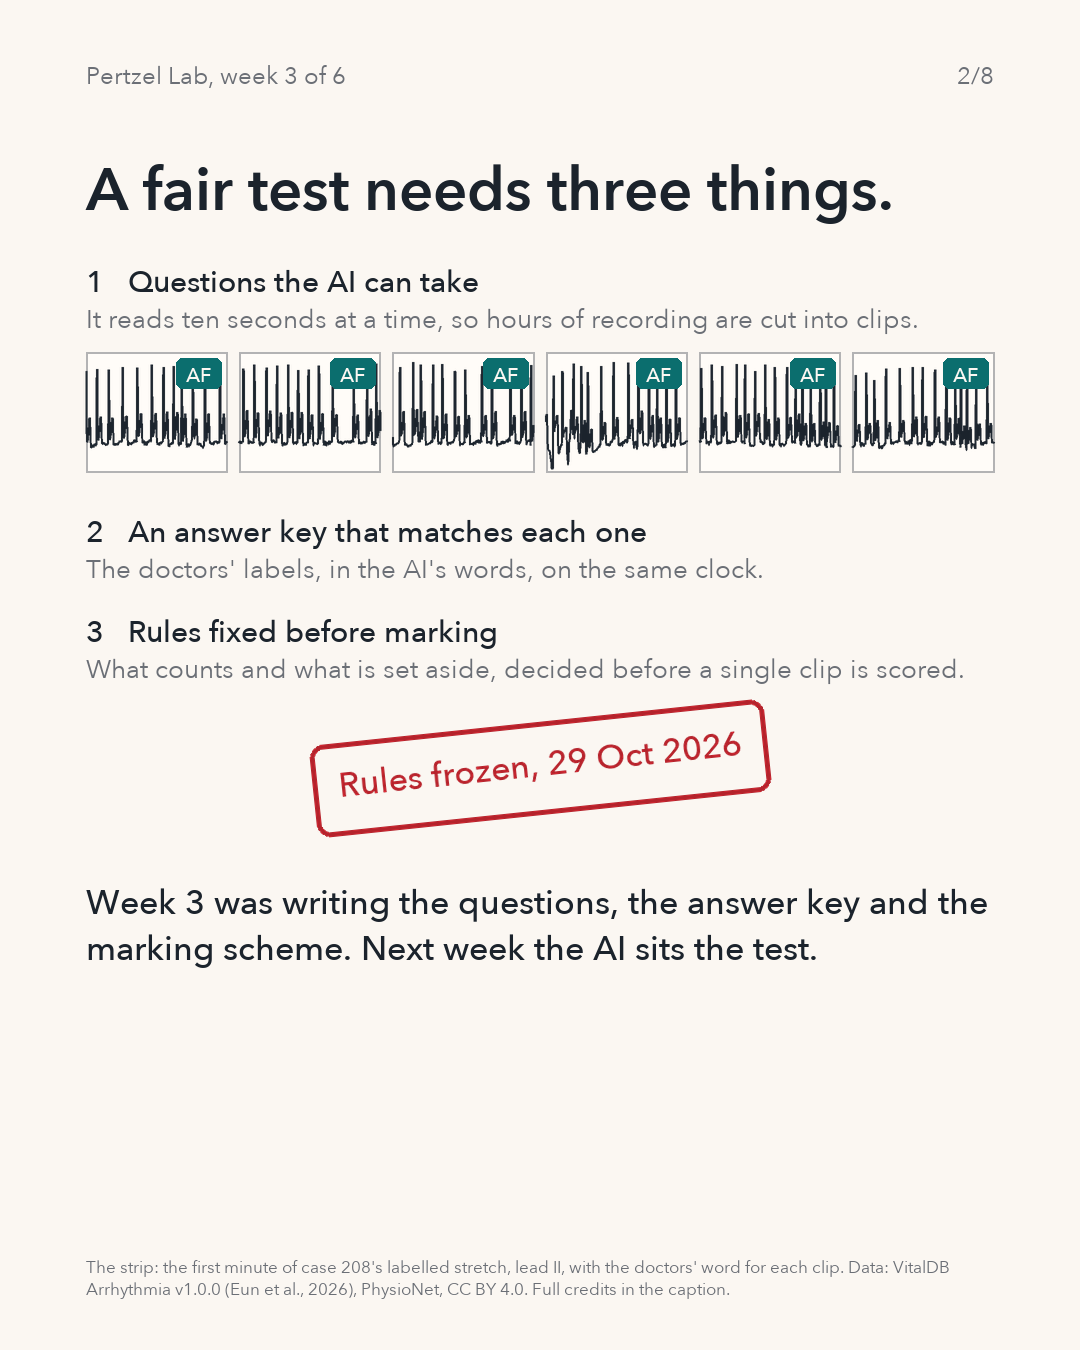
Questions the sitter can take. The model reads ten seconds at a time, so every labelled stretch is cut into ten-second clips on a fixed grid from the start of the stretch, never slid to catch an event.
An answer key that matches each question. The anaesthesiologists’ labels have to be in words the model can be scored on, and on the same clock as the clips.
Rules fixed before marking. What counts, what is set aside and how the two answers are compared were written down and frozen on 29 October, before a single clip is scored, so the flattering numbers cannot be chosen afterwards.
New to ECGs and the model?
An ECG records the heart’s electrical activity as a trace. ECGFounder is the trained AI software that reads a trace and makes 150 statements about it. VitalDB Arrhythmia is this week’s test material: surgical recordings with reference labels written by anaesthesiologists, the doctors who keep a patient under and watched through an operation.
Questions, answer key, marking scheme.
A minute of one recording is cut into six clips, each clip gets the doctors’ word for it, and the frozen rules land.
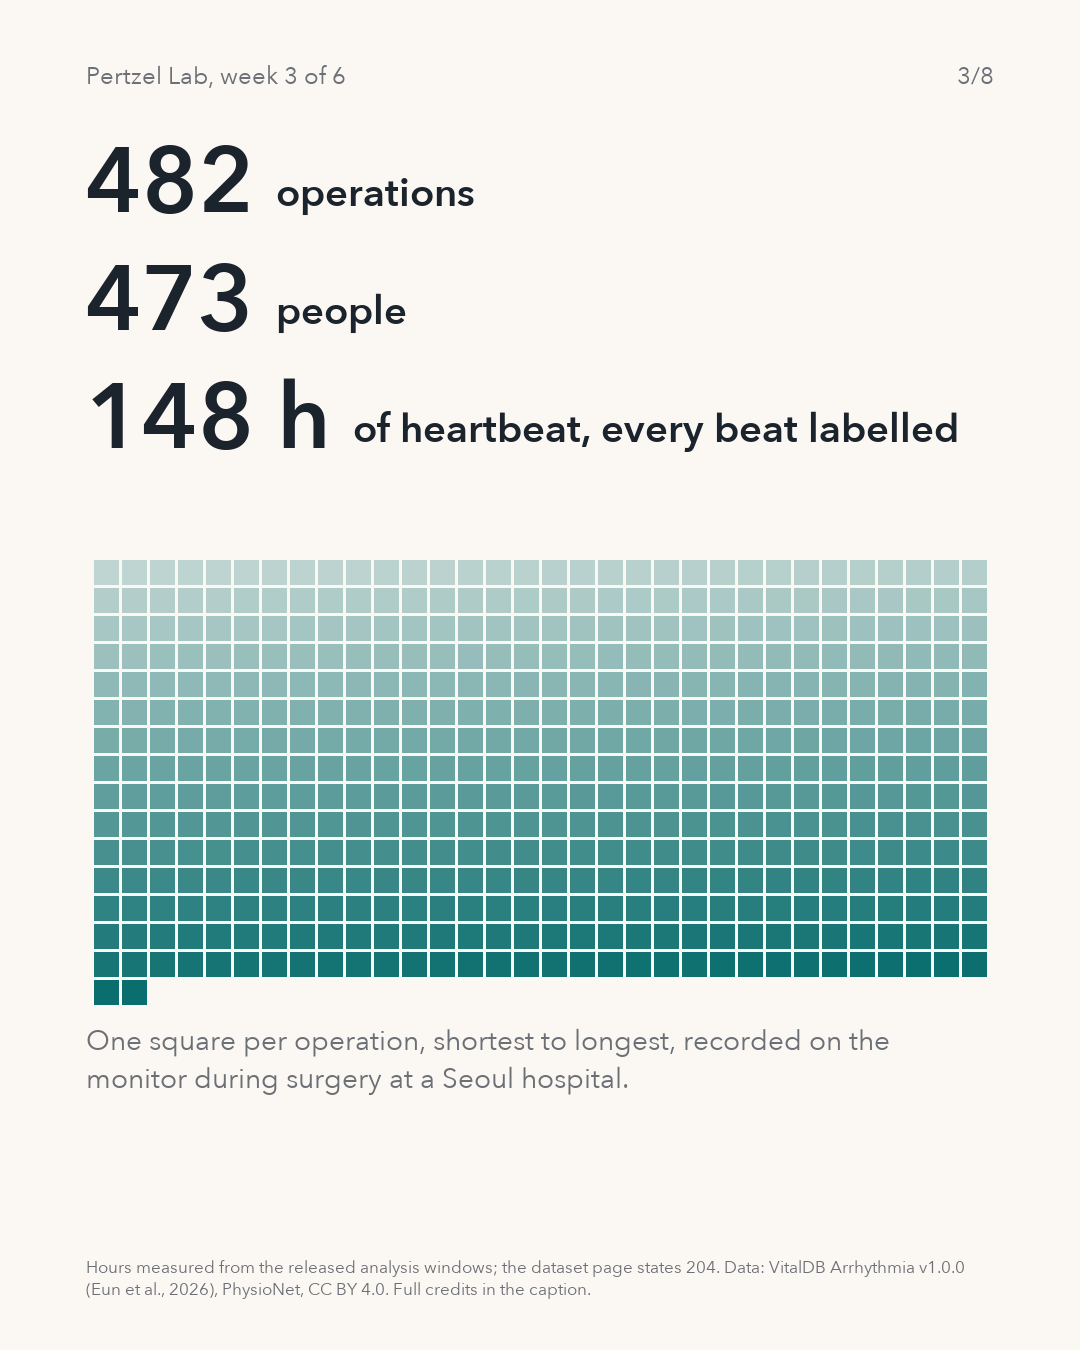
482 operations. 473 people. 148 hours of labelled heartbeat.
VitalDB Arrhythmia is a public release from a Seoul hospital: 482 surgical cases, each with a stretch of the monitor’s ECG labelled beat by beat by anaesthesiologists, at least two per stretch, with consensus. The release’s metadata lists 473 distinct patient identifiers across the 482 cases, so eight people appear more than once, 17 cases between them. The dataset page says 482 patients; I use the released identifiers and keep each person’s cases together.
The labelled stretches add up to 148.4 hours in the released analysis windows. The dataset page states 734,528 seconds, about 204 hours. I have not resolved that difference and report the measured figure.
The stretches are not a random sample of an operation. They were screened by an automated classifier for suspected rhythm trouble before labelling, so the labelled minutes lean towards hearts doing something unusual. That shapes what next week’s score can say.
One square per operation.
482 squares, shortest labelled stretch to longest.
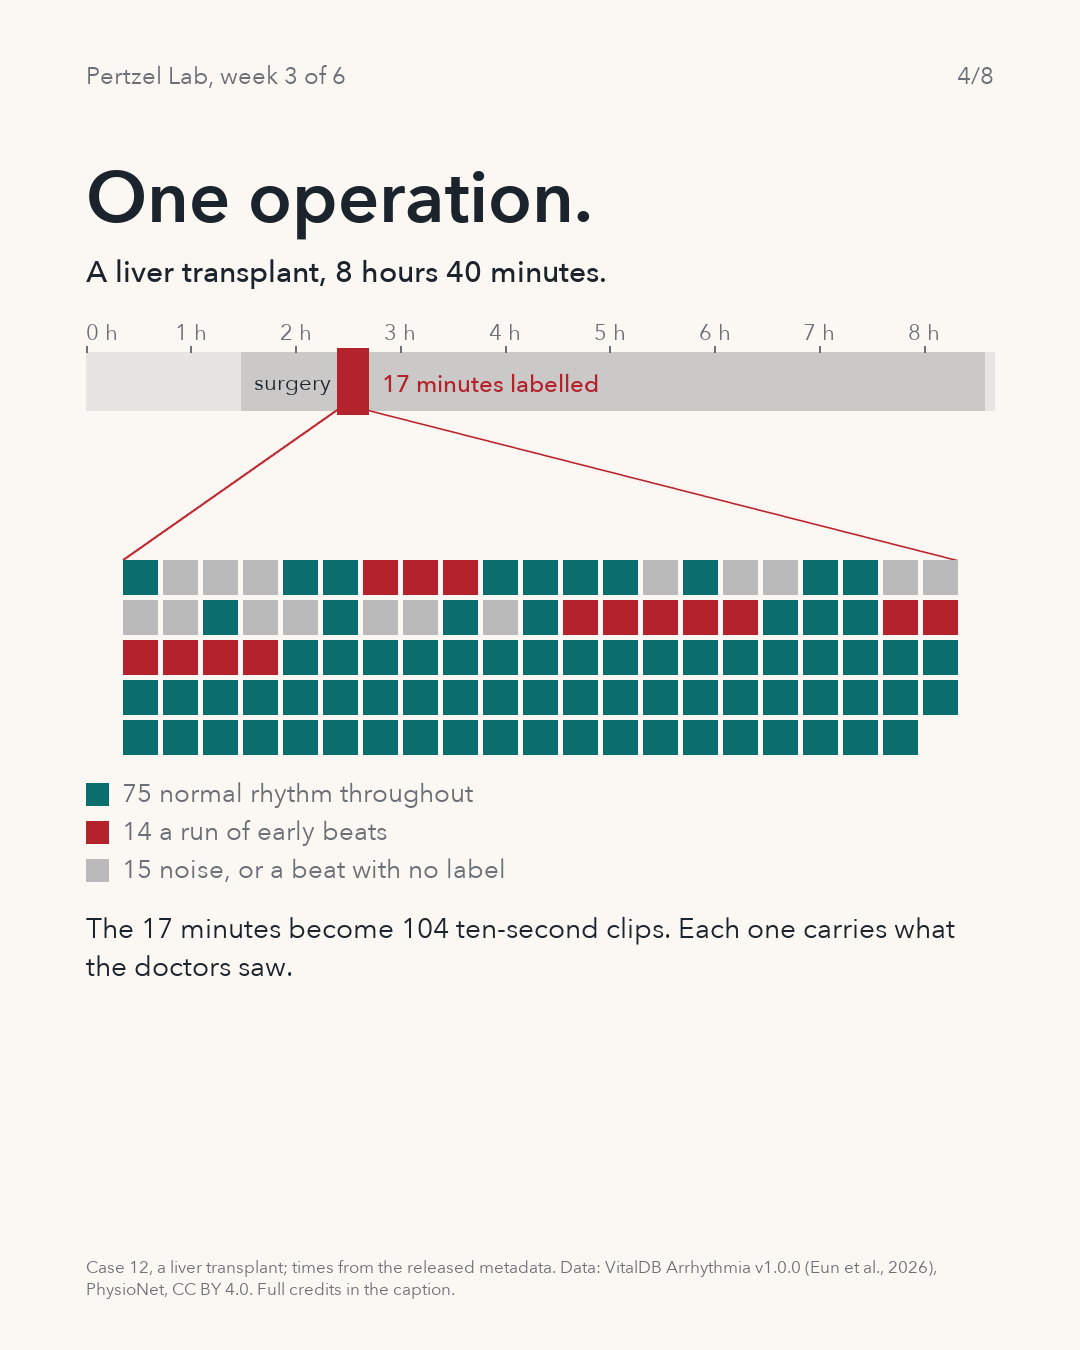
An answer key for 17 minutes of it.
A liver transplant, 8 hours 40 minutes from first record to last; the labelled 17 minutes become 104 ten-second clips.
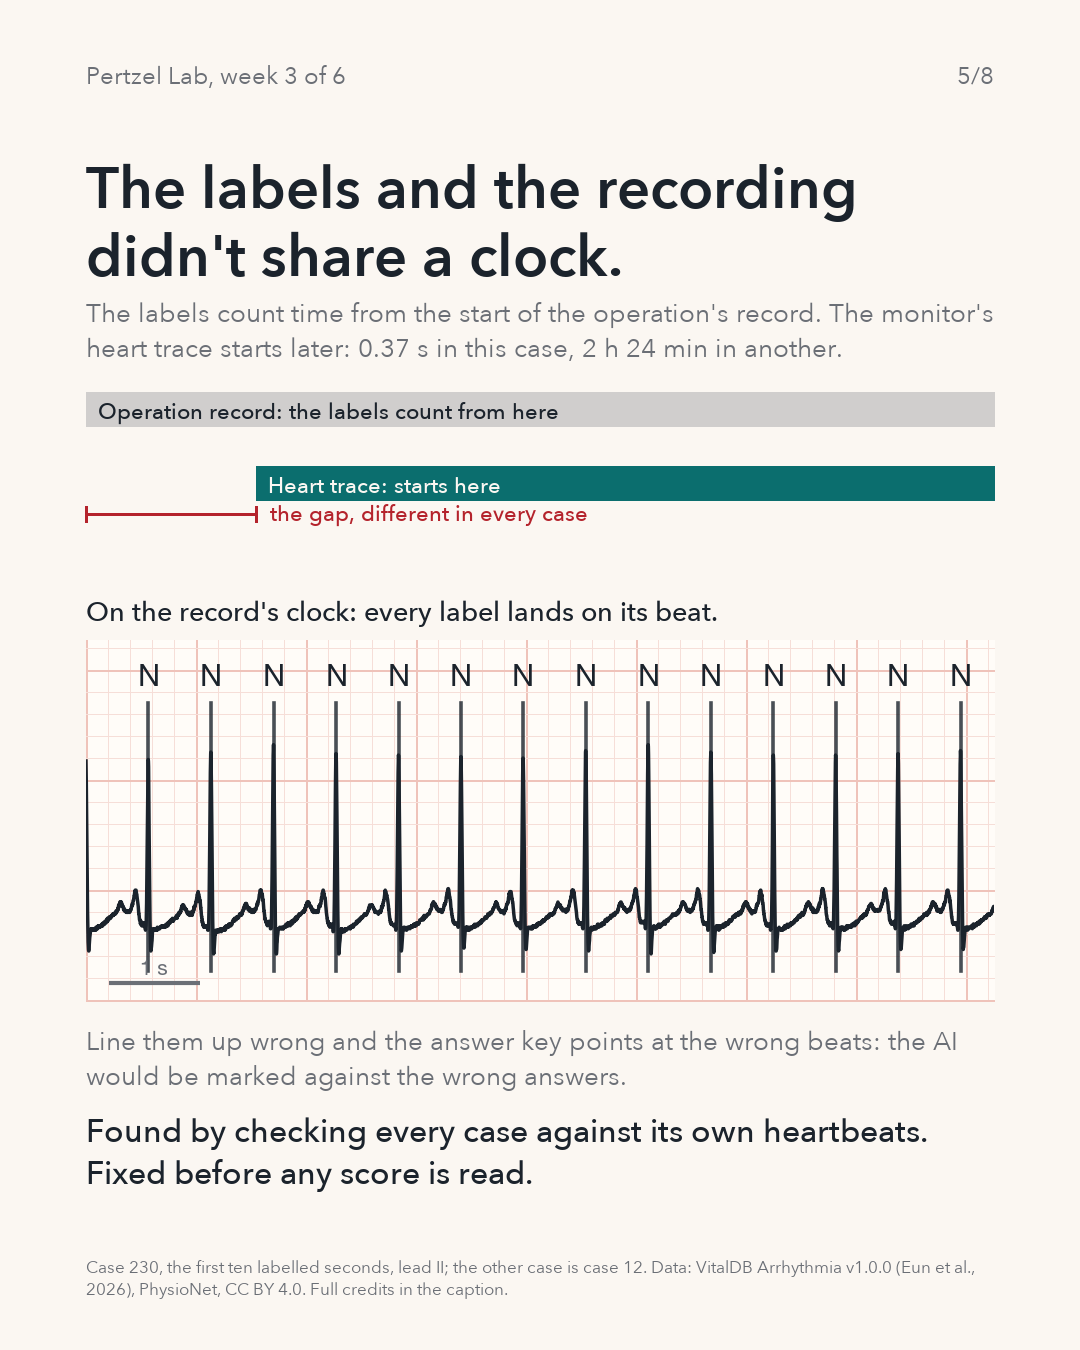
The labels and the recording didn’t share a clock.
The label times count from the start of the operation’s record. The ECG track in the waveform file starts later: 0.37 seconds later in case 230, and 8,633 seconds later, 2 hours 24 minutes, in case 12. Treat the first sample of the trace as time zero and every label slides off its beat by that gap.
Lined up wrong, the answer key points at the wrong beats. In the worst case I would be comparing the model’s reading of one part of an operation with the doctors’ word for a different part, and no score would mean anything.
The check uses the signal’s own evidence. I find the heartbeats in the trace without looking at the labels, then ask whether each label lands within 40 milliseconds of one. On the record’s clock, 95 to 100 percent of labels do in the 20 cases checked so far; on the trace’s own clock, between 0 and 36 percent. The check runs for every case before any score is read.
What it cannot tell me is whether the letter is the right letter. It proves where the labels sit, not that a beat marked N was normal or that a stretch marked AF was atrial fibrillation. For that there is only the doctors’ agreement, which is the reference I am scoring against, not the truth.
Every label misses, then every label lands.
The operation’s record and the heart trace start at different moments; on the wrong clock the labels fall between beats.
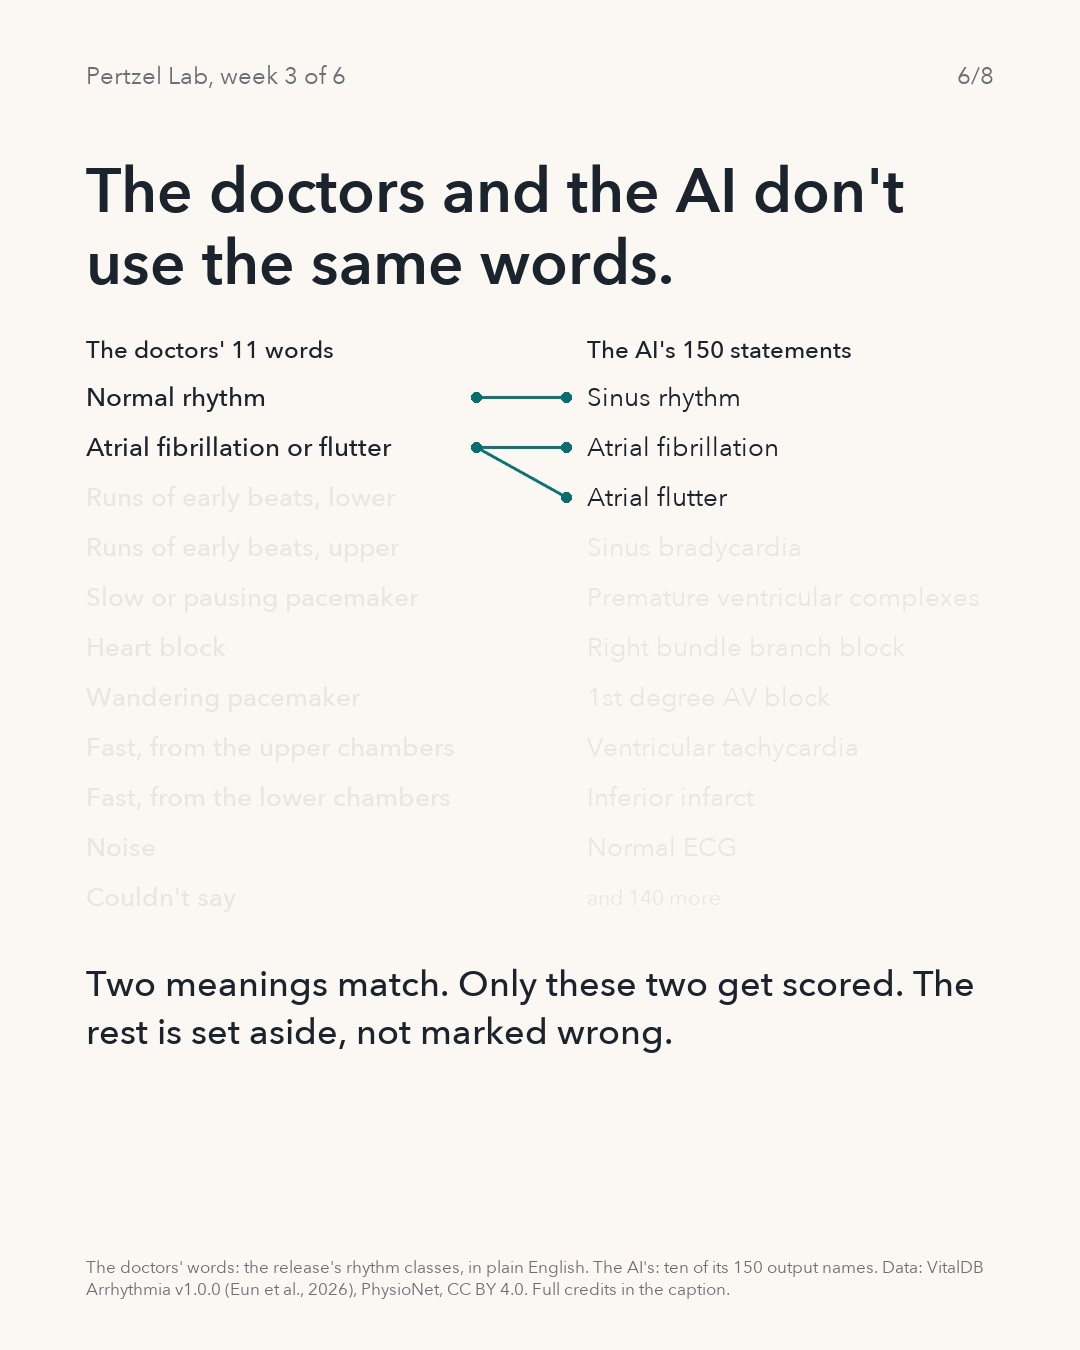
The doctors and the AI don’t use the same words.
The doctors describe stretches of rhythm with eleven labels. The model makes 150 statements about each ten-second clip. Only two meanings line up cleanly, and those are the two that get scored.
| Doctors’ label | Scored against | Why |
|---|---|---|
| N | SINUS RHYTHM, positive; negative for the atrial fibrillation or flutter endpoint | Rhythm-level comparison only; extra beats may coexist. |
| AFIB/AFL | The larger of ATRIAL FIBRILLATION and ATRIAL FLUTTER, positive; negative for sinus | The release does not separate fibrillation from flutter. The maximum is a ranking score, not a calibrated probability. |
| Patterned Ventricular Ectopy, Patterned Atrial Ectopy, SND, AVB, WAP/MAT, SVTA, VT | Set aside | Pooled categories, patterns that span more than one clip, or no single matching output. Not marked wrong. |
| Noise, Unclassifiable, blank | Unknown; set aside | No trustworthy reference. Never used as a negative example. |
Even “ventricular tachycardia” appears on both sides. But the doctors’ label covers an event that may run across many clips, and whether a ten-second slice of it is what the model’s output means is not established by the release. It waits for a documented later version of the rules, not a quiet assumption.
Set aside is not wrong. It means the model’s answer on that clip cannot be checked against a label I trust. So the model is scored on two things only, normal rhythm and atrial fibrillation or flutter, and everything else it says about these hearts stays unscored this season.
Two links, and the rest fades.
Eleven labels beside ten of the model’s 150 statements.
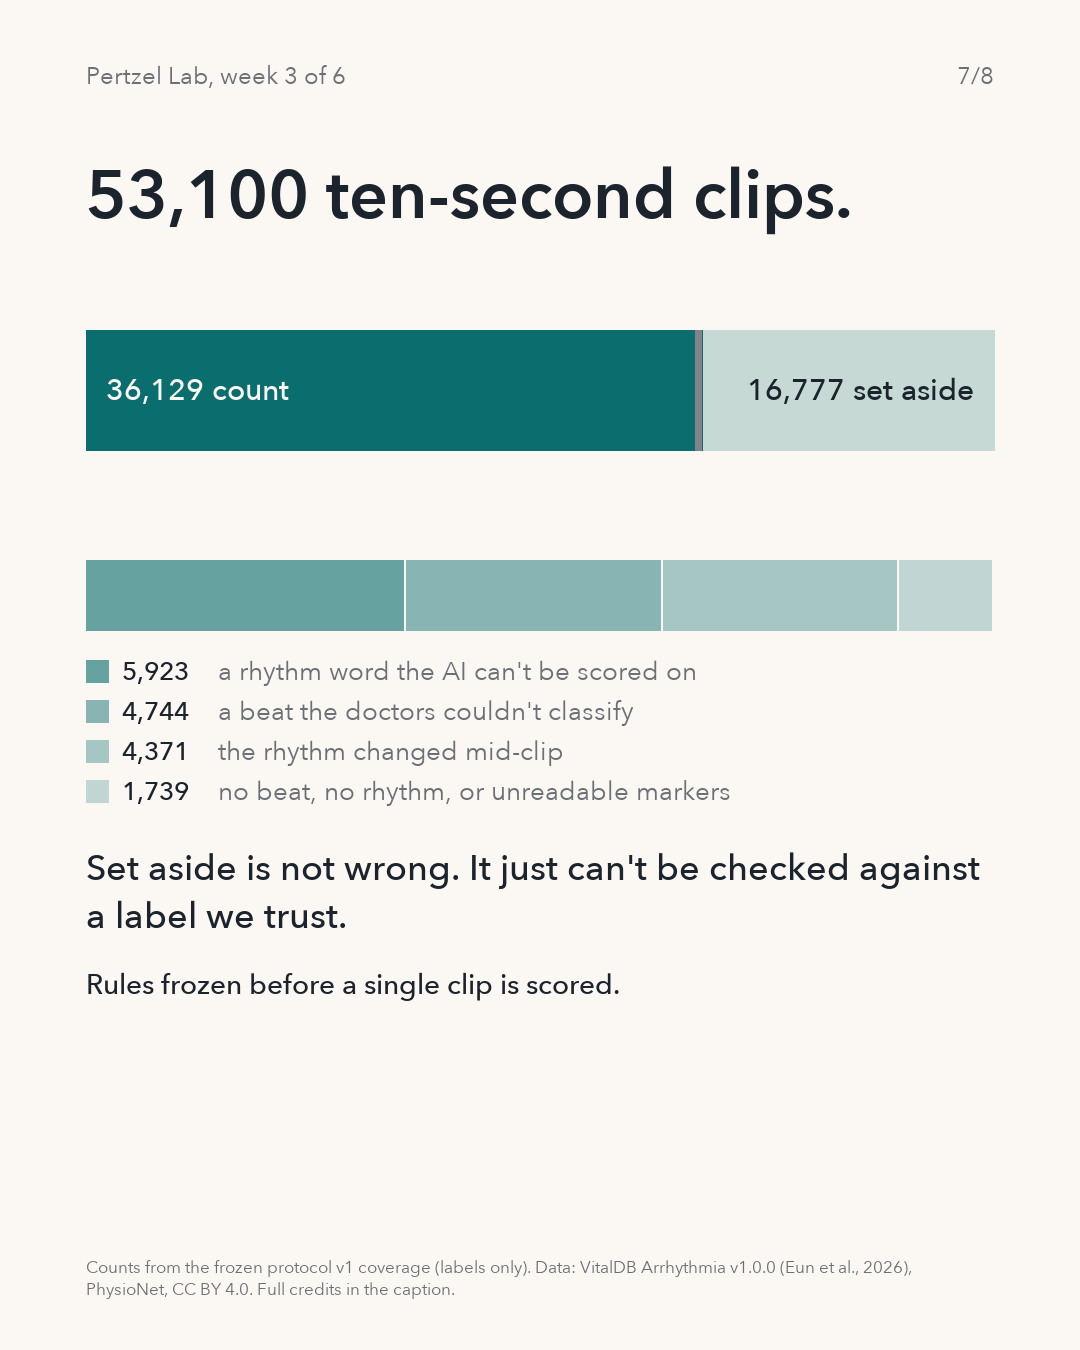
53,100 ten-second clips. 36,129 count.
Cutting every labelled stretch into complete ten-second clips gives 53,100 candidates. A clip counts when the doctors wrote one rhythm across all ten seconds, it is one of the two shared words, and they did not flag the signal quality: 36,129 clips from 450 cases and 442 patients, of which 25,607 carry normal rhythm and 10,522 atrial fibrillation or flutter. Another 194 clips meet every rule except the quality flag and form a separate side check. The remaining 16,777 are set aside.
| Clips | Reason |
|---|---|
| 5,923 | A rhythm word the model cannot be scored on |
| 4,744 | A beat the doctors could not classify, or a blank label |
| 4,371 | The rhythm changed inside the ten seconds |
| 971 | The case’s signal-quality markers could not be read (18 cases) |
| 406 | No labelled beat inside the clip |
| 362 | No rhythm written |
| 16,777 | Set aside in total |
These counts come from the labels alone. The waveform quality checks run with the evaluation, and anything they remove will be reported as a further exclusion, not tuned on the results.
The bar splits, then the set-aside part shows its reasons.
53,100 clips: 36,129 count, 194 flagged for a side check, 16,777 set aside.
No result yet, and some limits already known.
- There is no performance number on this page. Twenty cases went through the model as a pipeline test; no aggregate agreement has been calculated.
- Only two of the doctors’ eleven words are scored, against three of the model’s 150 outputs (sinus rhythm, and the larger of atrial fibrillation and atrial flutter). The other 147 outputs stay unscored this season.
- The labelled stretches were chosen by a screening program, so they are not a random sample of an operation or of everyday life.
- The clock check proves where the labels sit, not that they are right; the doctors’ consensus is the reference, not the truth.
- The released single-lead model was trained on lead I; VitalDB’s only ECG lead is lead II. A matched single-lead baseline on PTB-XL lead II is planned before the comparison is interpreted.
- Next week’s score first ranks the clips, as Week 2 did. Turning a ranking into a yes or no needs a line on the model’s probability, and where that line goes trades sensitivity, catching the real cases, against specificity, not raising false alarms. That line has to be written down before the run.
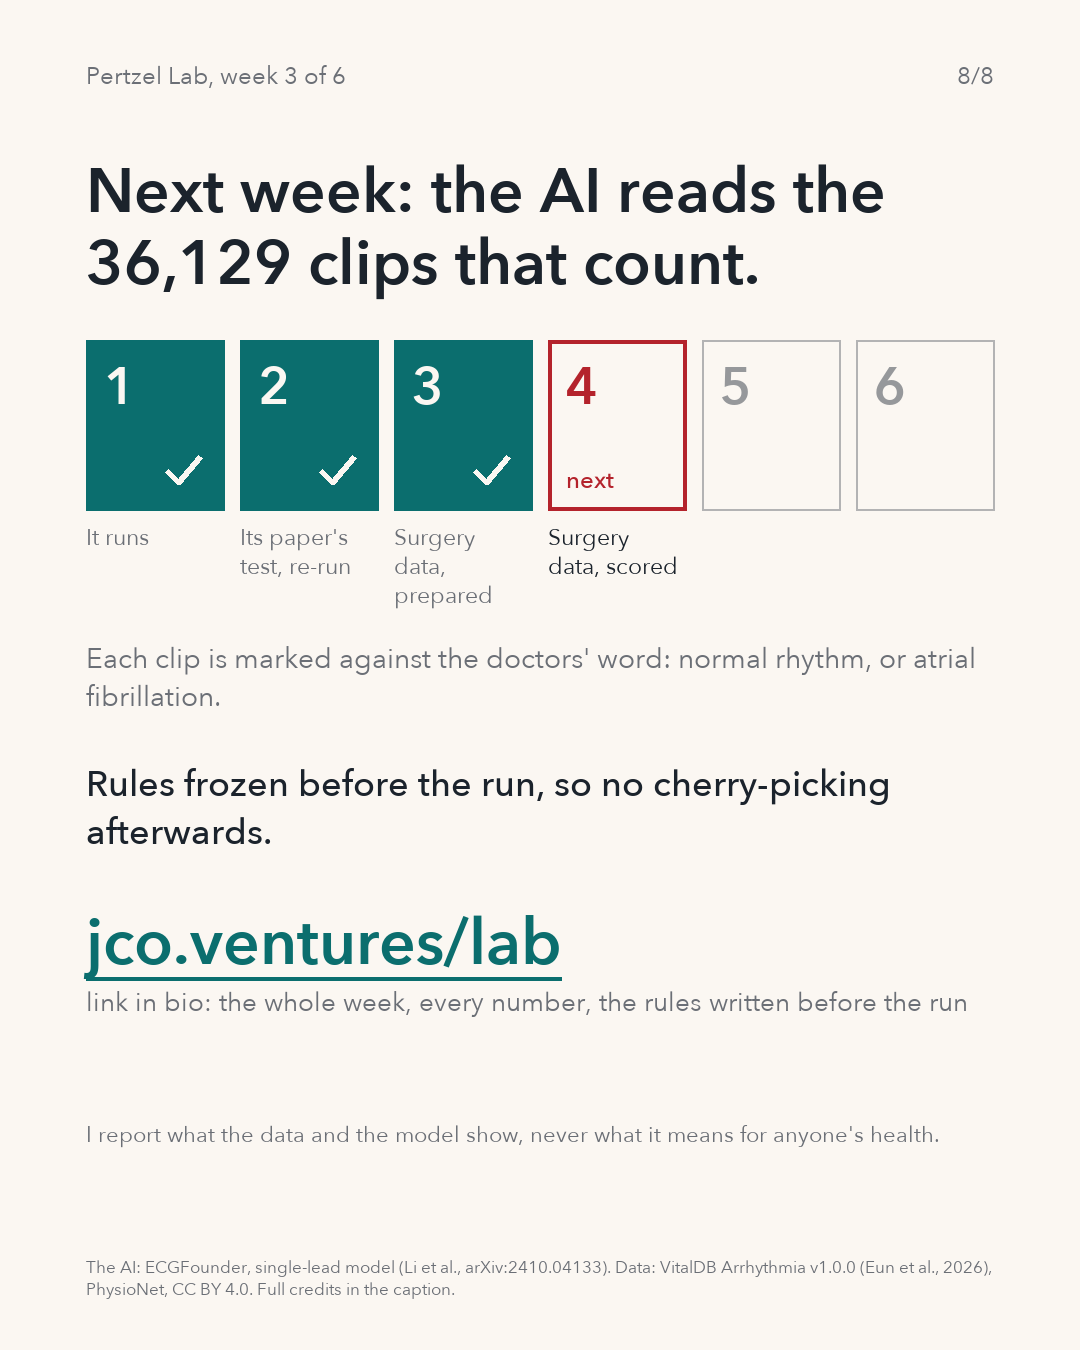
The AI reads the 36,129 clips that count.
The order, to be allocated at tonight’s planning session: the patient-grouped follow-up of Week 2 first, then a matched single-lead PTB-XL baseline on lead II, then the VitalDB run under the frozen rules, with calibration and subgroup views by age and recorded sex. Each clip is marked against the doctors’ word, normal rhythm or atrial fibrillation or flutter, and every case keeps all of its patient’s clips together.
The rules are protocol v1, frozen on 29 October 2026 (file hash beginning 468bc228). Any change before scoring would be a documented new version, not an edit.
Six weeks, one check at a time.
Weeks 1 to 3 done; week 4 is the run.
Every number on the slides, and where it comes from.
| Number | What it is | Status |
|---|---|---|
| 482 | Surgical cases with an annotation file | Measured; the dataset page says 482 patients |
| 473 | Distinct patient identifiers; 8 people with more than one case (17 cases) | Measured from the released metadata |
| 148.4 h | Sum of the released analysis windows | Measured; the page states 734,528 s, about 204 h |
| 8 h 40 min, 17.5 min, 104 | Case 12: record length, labelled stretch, complete ten-second clips | Measured |
| 0.37 s, 2 h 24 min | How much later the ECG track starts than the record, cases 230 and 12 | Measured |
| 95 to 100 %, 0 to 36 % | Labels within 40 ms of a detected beat on the record’s clock versus the track’s clock, 20 cases | Measured, pipeline test |
| 11, 150 | Rhythm labels in the release; output names in the model | Published by the release and the model |
| 53,100, 36,129, 194, 16,777 | Candidate clips; clips that count; flagged side check; set aside | Measured, labels only, protocol v1 coverage |
| 25,607, 10,522 | Counting clips labelled normal rhythm; atrial fibrillation or flutter | Measured |
| 450, 442 | Cases and patients with at least one counting clip | Measured |
- Original ECGFounder paper, version 4 · PDF
- VitalDB Arrhythmia v1.0.0 · Eun et al. · CC BY 4.0 · the labels and metadata
- VitalDB v1.0.0 on PhysioNet · Lee and Jung · CC BY 4.0 · the waveforms
- PTB-XL v1.0.3 · Wagner et al. · CC BY 4.0 · the planned matched baseline
The figures are the eight slides of this week’s carousel, rendered from the released files by the lab’s own code. This work reports what the data and the model show against a dataset’s reference labels. It does not provide health advice or establish clinical benefit. The lab repository is planned to become public with the Season 1 research output. The authors were contacted on 21 October; no answer is recorded as of 1 November.